Measurement Uncertainty: Reading the Evidence
No.
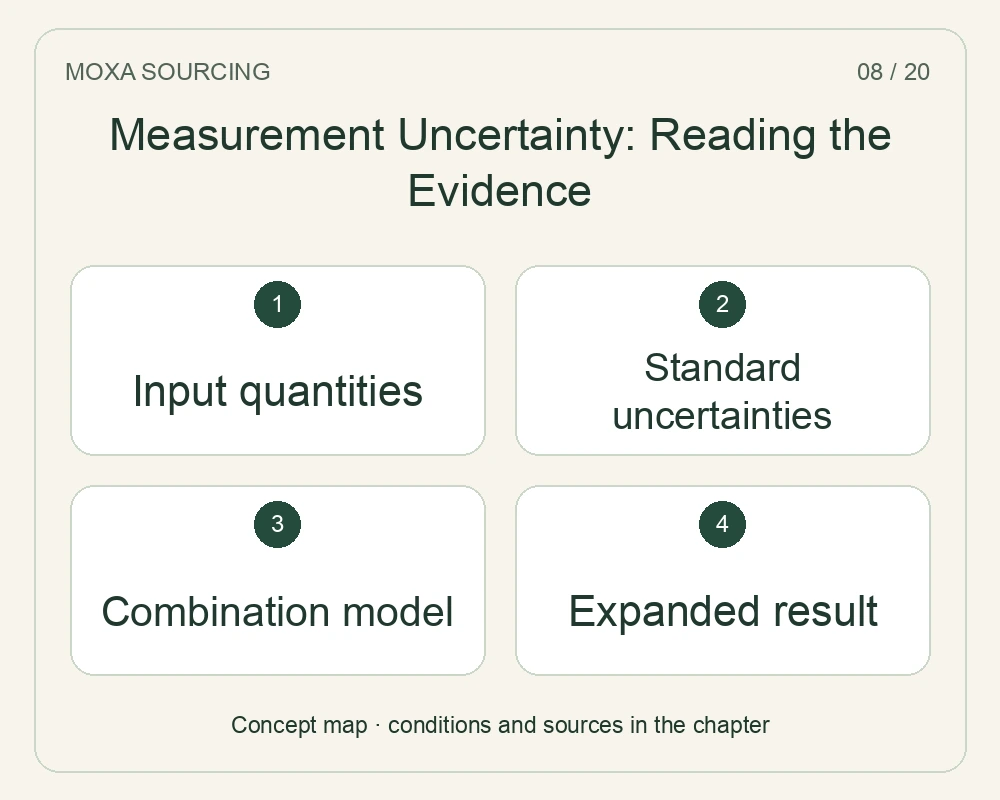
| Evidence or term | What it means here |
|---|---|
| Standard uncertainty | An uncertainty component expressed as an estimated standard deviation. |
| Combined standard uncertainty | The result of combining components using the measurement model. |
| Expanded uncertainty | Combined standard uncertainty multiplied by the stated coverage factor. |
What does the evidence explain?
Do Type A and Type B describe good and bad uncertainty evidence?
No. They distinguish methods of evaluation. Type A evaluates uncertainty by valid statistical treatment of data, such as the standard deviation of a mean, fitting a model or analysis of variance. Type B uses other relevant information and scientific judgment, including previous measurements, knowledge of materials or instruments, manufacturer specifications, calibration reports and reference data. Neither label alone establishes the reliability of the resulting estimate.
NIST explicitly cautions that a Type A evaluation based on limited data need not be more reliable than a sound Type B evaluation. The quality and relevance of the information matter. The labels also should not be substituted for “random” and “systematic”: the uncertainty of a correction for a systematic effect can itself be evaluated by either method. A useful uncertainty budget explains the basis for each component rather than ranking components solely by their A or B label.
How is uncertainty of an average different from spread among individual readings?
For independent observations made under the same measurement conditions, Appendix A uses their sample mean as an input estimate. Its standard uncertainty is the estimated standard deviation of that mean. In the usual notation this is s divided by the square root of n, where s describes the spread of the individual observations and n is their number. The independence and common-condition assumptions belong with this calculation.
Reporting the smaller uncertainty of an average does not mean that every individual reading has that smaller spread. Nor does averaging observations remove product-to-product variation from a batch. State whether the reported quantity is one observation, a repeated-measurement average or a quantity derived from several inputs. Repeated readings affected by a shared uncorrected influence should not be treated as if their number alone eliminates that influence. The measurement model and study design determine which contributions can be reduced by averaging.
Why should a quoted uncertainty be converted before combination?
A calibration report may quote an expanded interval rather than a standard uncertainty. NIST’s Type B guidance says that when a quoted uncertainty is a stated multiple of an estimated standard deviation, divide by that multiplier to recover the standard uncertainty. Adding or combining the quoted expanded interval directly with standard uncertainties mixes different measures.
If the report instead supplies a confidence level, the conversion depends on the distribution and interpretation. The guidance gives normal-distribution factors of 1.960 for 95 percent and 2.576 for 99 percent, unless another basis is indicated. These are not interchangeable with a universal divisor of two. Preserve the report’s stated factor and assumptions. When they are missing, identify the missing information rather than silently deciding what its “±” notation must mean.
What does a rectangular uncertainty model assume?
When only defensible lower and upper bounds are available and no information favors one position within them, NIST describes an equally probable, rectangular model. The input estimate is the midpoint of the bounds. If a is the interval’s half-width, its standard uncertainty is a divided by the square root of three. The half-width, not the full width, is used in that expression.
The distribution choice is an assumption to document. It is not established merely by seeing a manufacturer’s tolerance printed as plus or minus a value. Information that values near the center are more likely may support a different model. Equally, the rectangular assumption does not transform an unsupported limit into evidence. First establish what the bounds represent and their basis, then select the model appropriate to the available information. The resulting standard uncertainty belongs to that input estimate, not automatically to the complete product measurement.
How can the same interval produce different standard uncertainties?
The interval alone does not determine the distribution within it. NIST’s guidance gives a divided by the square root of six for a triangular distribution with half-width a, compared with a divided by the square root of three for a rectangular distribution. For a normal model whose almost-all-values interval means approximately 99.73 percent, it gives a standard uncertainty of approximately a divided by three. The meanings of those bounds differ.
A normal distribution has no finite bounds containing all its possible values. Its near-total interval therefore should not be described as an absolute guarantee. Likewise, the triangular model needs a reason for assigning more likelihood near the center. Record the distribution, interval meaning and conversion together. Selecting whichever divisor produces the smallest number would change the uncertainty statement without evidence and is not the evaluation described by the source.
Why should the measurement model include more than a physical formula?
Appendix A expresses the measured output as a function of input quantities. The inputs include corrections and factors for relevant sources of variation, potentially including observers, instruments, samples, laboratories and measurement times. NIST emphasizes that this function should describe the measurement process, not merely a physical law. Significant uncertainty contributions must be represented even when they are absent from a simple nominal calculation.
The output estimate is obtained from the estimated input values. To interpret a derived result, the reader therefore needs both the functional relation and the basis for those inputs. A result calculated from several quantities can have an uncertainty different from that of any single instrument reading. The model is also where the analyst identifies how a correction affects the reported result. Listing several certificates in a folder is not equivalent to relating their information to the actual output quantity.
Why is combining uncertainties not always a simple root-sum-of-squares?
The propagation law in Appendix A weights each input’s variance by the square of a sensitivity coefficient, the local response of the output to that input. It also includes covariance terms where input estimates are correlated. The familiar root-sum-of-squares simplification must not silently discard significant correlations or the effect of different sensitivities.
The stated formula is a first-order approximation. Its adequacy is one of the assumptions behind the uncertainty evaluation. A complex relation or an important correlated input needs appropriate analysis rather than an unqualified spreadsheet rule. The uncertainty budget should identify the input contributions in the output’s units and explain relevant dependencies. No particular covariance or sensitivity is supplied here for a mugwort test; those depend on the actual measurement model and available evidence.
Is uncertainty of a correction the same as the error being corrected?
No. NIST separates a recognized systematic effect from uncertainty about the correction needed to compensate for it. A correction can be positive, negative or zero. Its standard uncertainty describes incomplete knowledge of the correction’s value, not the original systematic error itself. Correcting a measurement does not make the correction perfectly known.
The guidance assumes significant recognized systematic effects are addressed, while acknowledging that practical constraints can sometimes limit correction. The evaluation should explain what was done and carry the relevant uncertainty. This distinction prevents a report from treating a large known offset as if it were merely harmless random scatter. It also prevents the opposite mistake of assuming that a corrected value has no uncertainty left. The correction, its basis and its remaining uncertainty should be identifiable as separate elements of the result.
How do combined standard uncertainty and expanded uncertainty differ?
Combined standard uncertainty, written u_c, represents the estimated standard deviation of the measurement result after its relevant components are combined. Expanded uncertainty, written U, is obtained by multiplying u_c by a coverage factor k. Thus U = k × u_c. A reported expanded value cannot be interpreted fully without the factor and its basis.
For example, doubling u_c changes the interval being reported, not the measured central value. It also does not change a product’s physical tolerance. Keep the measured value, uncertainty measure, coverage factor and acceptance specification distinct in the file. Two reports can state different numerical uncertainties for otherwise similar work because one reports u_c and the other reports U. Comparing the numbers without identifying which measure each uses can create an apparent disagreement that is simply a reporting difference.
Does a coverage factor of two always mean exactly 95 percent?
No. Under an approximately normal distribution and when uncertainty in the estimated standard uncertainty is negligible, NIST associates k = 2 with approximately 95 percent coverage and k = 3 with greater than 99 percent. For an ideal normal distribution the corresponding fractions are about 95.45 and 99.73 percent. Those conditions are part of the interpretation, rather than an automatic meaning attached to every doubled uncertainty.
The note explains that establishing a precise relationship between k and coverage can be difficult because it depends on the input distributions and how they combine. Low degrees of freedom can require a different factor for a specified confidence objective. A laboratory’s use of k = 2 should therefore be reported as a factor, with a justified probability interpretation if one is supplied. It should not be relabeled a guaranteed 95 percent interval without regard to the actual evaluation.
How does the NIST mass-standard example clarify uncertainty units?
The source’s nominal 100 g mass-standard example reports a measured value of 100.02147 g with a combined standard uncertainty of 0.35 mg. With k = 2, the expanded uncertainty is 0.70 mg, or 0.00070 g. With k = 2.26, the expanded uncertainty is 0.791 mg, reported as 0.00079 g after rounding. The second example associates that factor with a t distribution and nine degrees of freedom.
The examples demonstrate reporting conventions, not results from our products or an acceptable packing-weight tolerance. They also show why the value and uncertainty need compatible units before comparison. A number in milligrams is not directly comparable to the same printed number in grams. The coverage statement differs between reporting u_c and U, and depends on the basis explained in the source. Keeping units and factors explicit prevents a transcription error from being mistaken for a product difference.
What supporting information belongs with a reported uncertainty?
NIST’s reporting guidance calls for the uncertainty measure and, when expanded uncertainty is used, its coverage factor. It also includes the components of standard uncertainty, relevant degrees of freedom, the combined value and how each component was evaluated. A probability interpretation needs a stated basis. These details can be supplied in the report or through an appropriate published method reference.
The reference must describe the process actually in use. The source explicitly warns that referenced documents should remain up to date and consistent with the current measurement process. A familiar method title alone does not resolve whether a different instrument, correction or analysis was used for the reported result. When reviewing a report, distinguish unavailable supporting detail from a demonstrated absence of a contribution. Missing budget information is a documentation gap; it does not prove the uncertainty is zero.
Does a calibration uncertainty automatically include shipping and later use?
The NIST guidance normally reports the uncertainty obtained for its measurement, rather than adding an estimate of every future use. For a customer’s standard returned after calibration, the quoted uncertainty does not normally include all effects that transport, elapsed time or a different laboratory environment might later introduce. A caution or separately estimated additional uncertainty may be supplied when relevant.
If an additional contribution is combined for convenience, the source calls for a clear explanation. The user therefore needs to understand which conditions the calibration report covers and which later conditions require separate consideration. This is distinct from assuming the calibrated item was damaged: an additional-use question is not evidence that damage occurred. The point is to preserve the boundary between the calibration result and the subsequent measurement process that uses that result.
Does an uncertainty statement itself set the product acceptance limit?
An uncertainty statement characterizes the measurement result and its evaluation. A product acceptance limit expresses a requirement for the selected characteristic. The quantities can interact in a decision, but they are not interchangeable. A change in coverage factor changes the reported uncertainty interval; it does not authorize changing the agreed product specification.
The sourcing file should therefore retain the requirement, result, uncertainty basis and agreed decision rule as separate items. If the applicable rule needs information that the report does not supply, keep the decision unresolved until the gap is addressed. This is an editorial application of the source’s distinction between the result and its uncertainty, not a newly prescribed guard band or universal pass/fail formula. No acceptance conclusion about an actual sample follows from the explanatory mass-standard examples.
FAQ
Do Type A and Type B describe good and bad uncertainty evidence?
No. They distinguish methods of evaluation. Type A evaluates uncertainty by valid statistical treatment of data, such as the standard deviation of a mean, fitting a model or analysis of variance. Type B uses other relevant information and scientific judgment, including previous measurements, knowledge of materials or instruments, manufacturer specifications, calibration reports and reference data. Neither label alone establishes the reliability of the resulting estimate.
Does an uncertainty statement itself set the product acceptance limit?
An uncertainty statement characterizes the measurement result and its evaluation. A product acceptance limit expresses a requirement for the selected characteristic. The quantities can interact in a decision, but they are not interchangeable. A change in coverage factor changes the reported uncertainty interval; it does not authorize changing the agreed product specification.
Sources and scope
Sources: NIST Technical Note 1297 sections 3–7 and Appendix A. General measurement-uncertainty guidance and the source mass-standard illustration; no current SKU measurements, mandatory order tolerances or universal acceptance rule. Probability statements retain their distribution and degrees-of-freedom conditions. NIST TN1297 3 NIST TN1297 4 NIST TN1297 5 NIST TN1297 6 NIST TN1297 7 NIST TN1297 Appendix A